Porthole
2009
Application For Viewing Real Time Sensor Data in Augmented Reality

Porthole was an experimental application that extended the universe of Pachube data into the context of AR – a 'porthole' into Pachube's data environments.


Pachube.com is a platform that enables thousands of individuals and companies around the world to store, share & discover realtime sensor, energy and environment data from objects, devices & buildings – a platform for building the 'Internet of Things'.

Porthole was an experimental application that extended the universe of Pachube data into the context of AR – a 'porthole' into Pachube's data environments.
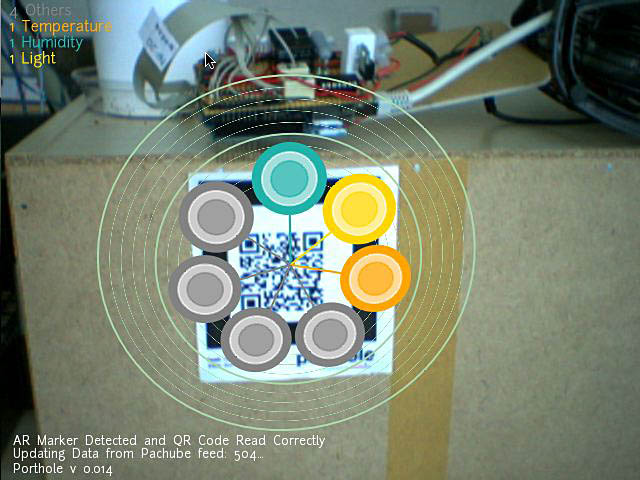
The application relies on the marker based ARToolkitPlus to orient 3D graphics around markers which are generated on the Porthole web page, printed and placed at points of interest. Inside each of these markers is a QR 2D bar code which - once the marker is discovered by the software – is decoded2 to enumerate the ID of the environment being queried.
Porthole automatically pulls both real-time and historical data relating to that environment from Pachube3. Users can print markers that relate to the data feeds they have registered or those of others they are generally interested in a tracking.
Thus the marker itself provides an interface to quickly correlate a real-world location with real-time values for temperature, or carbon-footprint, or any of the myriad of variables that can be tracked with Pachube generate at that location. The current version of the application allows users to see, at a glance, which types of data are available, the current values and standard deviations on closer interaction view graphs of historic data values.
This approach has advantages for creating networked objects connected to the internet, as part of the general category known as the 'internet of things'. The interpretation and processing of sensor and environment data, alongside meta-data and historical comparison can be separated from the device. Rich data from objects or environments can then have local relevance despite being systematically separate from the device. Using 3D graphics orientated on top of the marker, it also becomes possible to read these various values as though one might read a thermometer or to quickly maintain a large cluster of networked objects – without needing a hardware display system built into the device.